Stanbic Bank’s five-year performance story is, above all, a profit story.
It offers the clearest window into how the bank has transformed its balance sheet, expanded lending, deepened customer deposits, grown revenue, managed costs, and rewarded shareholders between 2021 and 2025.
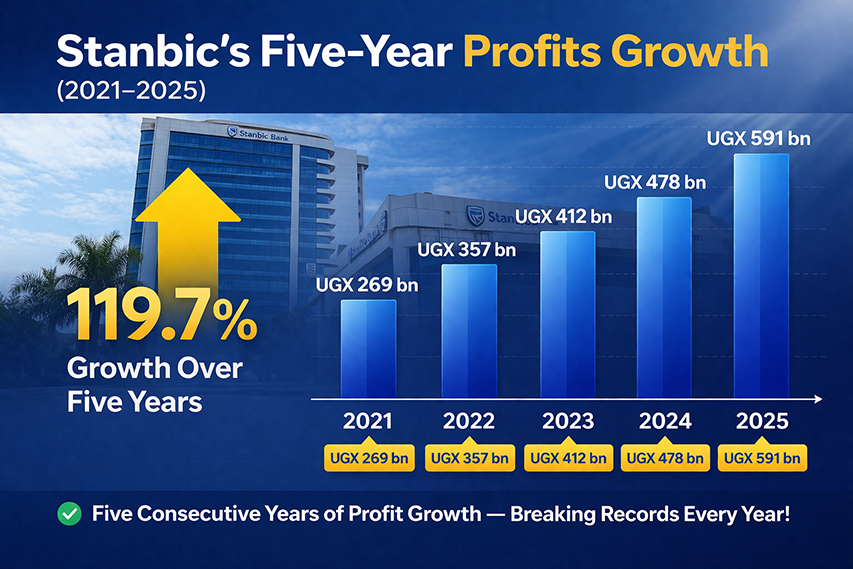
The headline number is striking. Profit after tax rose from UGX 269 billion in 2021 to UGX 591 billion in 2025, more than doubling over five years, with a compound annual growth rate (CAGR) of 21.7%.
The trajectory tells an even richer story. Profit increased steadily to UGX 357 billion in 2022, UGX 412 billion in 2023, UGX 478 billion in 2024, before surging again in 2025.
This is not the pattern of one-off gains, but of a bank that has steadily built a broader earnings base and translated it into consistent bottom-line growth.
What matters is not just that profits rose, but why.
Stanbic’s five-year metrics show that earnings growth was supported by steady expansion in customer deposits, faster growth in loans and advances, a larger revenue base, and improved operating efficiency,even as total costs increased. In other words, profit growth was driven by scale, not isolation.
Deposits: The foundation of growth
Customer deposits, the bank’s funding base, grew from UGX 5.741 trillion in 2021 to UGX 8.027 trillion in 2025, a compound annual growth rate (CAGR) of 8.7%.
While slower than profit growth, this remains one of the most critical indicators. Deposits are the raw material of banking, funding lending and investment activities.
An increase of nearly UGX 2.3 trillion signals sustained customer confidence and a strengthening franchise.
Lending: Accelerating asset deployment
Loans and advances rose from UGX 3.722 trillion in 2021 to UGX 5.091 trillion in 2025. While the five-year CAGR stands at 8.1%, the standout figure is the 16.4% jump in 2025.
This suggests that after years of measured expansion, Stanbic significantly accelerated credit deployment.
Faster loan growth is typically the clearest driver of higher net interest income; provided asset quality remains stable.
Stanbic appears to have effectively converted its growing deposit base into earning assets, improving its ability to monetise the balance sheet.
Trade finance: A slower growth segment
Trade finance contingent balances grew modestly from UGX 1.920 trillion in 2021 to UGX 2.039 trillion in 2025, reflecting a CAGR of just 1.5%.
This slower pace indicates that trade finance has not been a primary growth driver. According to Paul Muganwa, Executive Director and Head of Corporate and Investment Banking, trade finance performance is closely tied to Uganda’s economic structure, particularly infrastructure development.
Demand for instruments such as guarantees and letters of credit depends heavily on large projects in sectors like energy and transport.
Slower project pipelines in recent years have constrained growth, although a temporary uptick around 2022 was linked to oil and gas activity.
Muganwa notes that trade finance is inherently cyclical, but remains optimistic that increased investment in infrastructure and energy will drive stronger growth in the medium term.
Total assets: Entering a new scale
Total assets expanded from UGX 8.72 trillion in 2021 to UGX 11.525 trillion in 2025, a CAGR of 7.2%.
The sharp increases in 2024 and 2025 are particularly notable, with the bank crossing the UGX 10 trillion mark and adding over UGX 1.1 trillion in assets within a single year.
This growth was largely funded by customer deposits, indicating stable, high-quality expansion rather than reliance on volatile wholesale funding.
Revenue: Broad-based income growth
Total revenue rose from UGX 406 billion in 2021 to UGX 651 billion in 2025, reflecting a CAGR of 12.2%.
Net interest income grew from UGX 498 billion to UGX 788 billion over the same period, supported by higher average loan balances and financial investments. In 2025 alone, it grew by 3.7% year-on-year.
Non-interest revenue also strengthened, driven by increased transaction volumes and business activity.
This diversification is significant. It shows Stanbic is not solely reliant on lending margins but has developed multiple income streams, enhancing resilience against shocks in any single segment.
Costs and efficiency: Positive operating leverage
Total costs rose from UGX 382 billion in 2021 to UGX 678 billion in 2025, a CAGR of 8.9%.
While costs increased, especially after 2022, they grew more slowly than both revenue and profit. This indicates positive operating leverage: the bank generated more income for every unit of cost.
The cost-to-income ratio improved slightly to 47.1% in 2025 from 47.2% in 2024. Though marginal, this improvement during a period of rising costs signals strong execution.
Dividends: A shift toward shareholder returns
Dividend payouts grew dramatically from UGX 50 billion in 2021 to UGX 360 billion in 2025, a CAGR of 63.8%, the fastest among all metrics.
This reflects growing confidence in earnings sustainability and a strategic shift toward higher shareholder distributions.
The 2025 payout comprises UGX 220 billion in proposed dividends and UGX 140 billion in interim dividends.
Stanbic is increasingly positioning itself as a high-distribution bank while still expanding its asset base.
Supporting indicators: Strength and signals
Additional indicators reinforce the broader story. Return on equity rose to 26.8% in 2025 from 24.3% in 2024, showing stronger returns on shareholder capital.
Earnings per share increased to UGX 11.54 from UGX 9.34, indicating improved value per share.
The share price climbed by 53.7% to UGX 60.32 from UGX 39.25, suggesting the market is pricing in stronger profitability and higher payouts.
Meanwhile, the non-performing loan ratio edged up slightly to 1.7% from 1.5%, a modest deterioration but still within manageable levels.
| Metric | 2021 | 2022 | 2023 | 2024 | 2025 |
|---|---|---|---|---|---|
| Profit After Tax (UGX bn) | 269 | 357 | 412 | 478 | 591 |
| Customer Deposits (UGX tn) | 5.741 | 6.131 | 6.633 | 7.107 | 8.027 |
| Loans & Advances (UGX tn) | 3.722 | 4.085 | 4.225 | 4.374 | 5.091 |
| Trade Finance (UGX tn) | 1.920 | 1.929 | 2.101 | 2.104 | 2.039 |
| Total Assets (UGX tn) | 8.720 | 9.059 | 9.303 | 10.393 | 11.525 |
| Total Revenue (UGX bn) | 406 | 489 | 565 | 638 | 651 |
| Net Interest Income (UGX bn) | 498 | 589 | 709 | 760 | 788 |
| Total Costs (UGX bn) | 382 | 425 | 534 | 612 | 678 |
| Dividends (UGX bn) | 50 | 235 | 280 | 300 | 360 |
The the five-year picture
Taken together, the data shows a bank that has become larger, more profitable, and more efficient over five years, with the strongest momentum in the most recent period.
There are, however, caution signals. Trade finance growth has been subdued, costs have risen materially, and asset quality, while still strong, requires close monitoring as lending accelerates.
Even so, the overall trajectory is clear.
Stanbic has evolved from a bank generating UGX 269 billion in profit to one delivering UGX 591 billion. It has deepened deposits, expanded credit, improved returns, and significantly increased shareholder payouts.
This is not just growth in size—it is growth in earning power.