
What is the Commission’s overall take on the competitiveness landscape across the various segments of the telco industry and how is this likely to shape the development of the sector in 2023 and beyond?
While the Commission continues to promote fair and competitive conduct across the communications value chain (markets), we note that some segments of the market/value chain are not as competitive as others.
The differences in competitiveness at various layers of the telecommunications value chain may be attributed to differences in structural drivers such as market size as well as policy influences in the respective segments. Sometimes a segment can only have a limited number of actors based on market, policy, and natural limitations.
That notwithstanding, we continue to see improvements in competitiveness in segments such as retail mobile voice and broadband in which we have two strong incumbents and a host of smaller/newer competitors.
In the fibre and fixed broadband services, we remain with a limited number of actors largely driven by the efficiency and capital structures of the FTTX segment.
In the tower segment, in the last 3 years, we saw an African-wide consolidation of two previously competing firms. This multi-market consolidation included Uganda and we ended up with a very strong singular supplier of passive cell site services (towers). To control potential abuses, UCC put in place a number of conduct and structural obligations on the post-merger outfit to ensure Fair, Reasonable and Non-discriminatory conduct in this space. These measures included; regulatory price approval obligations, divestiture of some of the interest of one of their large customers, and moratorium on price increases, among others.
In addition to the conduct obligations, the Commission has licensed new TowerCos to improve provider choice in this segment.
In terms of the general market competitiveness outlook, we see a number of strategic and commercial shifts that will continue to influence product competition, and ease of entry into new markets (market contestability) as well as long-term relevance of the incumbent local providers.
These include; the continued proliferation of new satellite broadband and backhaul solutions from new players like Starlink and AST Space Mobile, new push from OTT payments solutions (GooglePay, Whatsapp Pay), pressure from neobanks and cross-border wallets, new demand for small cell 5G radio infrastructure in metropolitan areas among others.
In light of the ATC/Airtel/Ubuntu anti-competition ruling in May 2022, has UCC been able to review other contracts in the industry to ensure competitiveness and fair play?
Yes.
Following the Commission’s nullification of “Right of First Refusal – ROFR” clauses in Master Service Tower Agreements in some incumbent contracts, we have in the last six months overseen MTSA amendments.
The nullification of ROFRs in access agreements was a regional regulatory first. Indeed, incumbent leasers can now enter new tower lease agreements with alternative providers without any commercial restrictions.
Beyond the MTSAs, the Commission continues to enforce its veto power in the review and approval of interconnect and access agreements. Specifically, the Access & Interconnect Regulations, 2019 oblige the Commission to review and approve or reject commercial B2B agreements/contracts in wholesale messaging, voice interconnect and fiber IRUs, among other services.
In the ruling above, UCC said that ATC controlled 87% of the tower market share and 90% of sector revenue, although the Commission was yet to undertake a study to determine if ATC was a Dominant Operator. Has this happened? And if yes, what does it mean to declare a player, a dominant operator?
The Commission undertakes sector-specific (Telecom, Post and Multimedia) Market Definition and SMP assessments on a rolling basis. In the last two years, we have completed the Post and Broadcast/Multimedia Market Definitions.
A telecom sector (Infrastructure and Services) market definition and SMP assessment is planned for next FY.
In a market definition, the goal of the Commission is to identify those services/goods for which a hypothetical monopoly supplier can increase prices or degrade quality without fear of loss of sales to an alternative good. The conceptual motivation for such an exercise is to identify the lines of commerce and limits of competition between goods and services.
From such an exercise, we then proceed to the question of dominance within markets/service bundles. Here, the conceptual question is to what extent can one of the individual suppliers in a market act without fear of share loss by competitors.

The EU’s 2018 Guidelines on market definition and SMP assessment in electronic markets is a good reference in SMP determinations for national regulatory authorities like UCC.
The combination of market definition and dominance assessment is a foundation in the determination of regulatory interventions to curb potential dominance abuse. It’s from these efforts that the Commission designs conduct obligations in pricing, contracting and consumer protection, among other regulatory interests.
 Equity Bank Rwanda Hit by Fraud, Months After Group CEO, James Mwangi’s Integrity Crackdown
A designation of Dominance ordinarily translates into higher conduct and consumer protection obligations for a licensee. This could be in the form of; Must offer obligations (e.g Signet), heightened price review procedures, price disclosure obligations, asymmetric interconnection obligations, and Grade of service and continuity obligations, among others.
Away from the Tower Cos, overall, it has been said Uganda is home to one of the most expensive internet and communication sectors. In light of the huge market power held by some of the players in the towers and telecom space, what is the Commission doing to protect the consumers?
We may need to clear the misconception that Uganda is one of the more expensive broadband markets. While our fixed broadband pricing is understandably not as competitive due to scale disadvantages, we are a very price-competitive market in the mobile wireless segment.
We often undertake regional price comparisons and comparing country market leader offers is one of the simpler nominal price comparison approaches. Uganda compares favourably well against our regional peers. See chart below.

Figure 3: A4AI Mobile Internet Affordability Index, 2021
Source:https://a4ai.org/affordability;report/data/?_year=2021&indicator=INDEX
This comparison is further vindicated by other global internet affordability rankings like the A4AI 2021 index which places Uganda ahead of the EAC region in terms of mobile broadband affordability.
The relatively favorable regional price comparison notwithstanding, consumer protection remains a fundamental mandate of the Commission.
In the realm of retail service pricing, we continue with efforts in enhancing pricing transparency through regular price comparison publications, a digital price comparison portal (www.kompare.ug) as well as a focus on truthfulness in marketing communications. These are supplemented with regular price assessments to promote Fairness and Reasonableness in pricing.
New initiatives are also underway to improve metering transparency in the sector. We are in consultation with the industry to establish new metering and billing assurance frameworks. We hope this will put to rest questions about bill accuracy and other related claims.
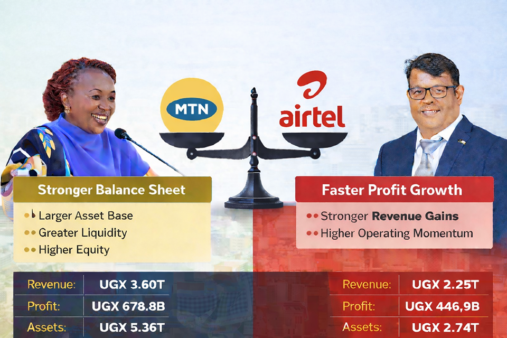
A review of the financial performance of the two major telcos shows significant profitability of between UGX300 billion and UGX400 billion. Compared to other companies in Uganda with similar gross earnings, the telcos seem to be enjoying excessively high margins. How do the telco margins in Uganda compare to other markets?
In terms of revenue and profitability comparisons, the two leading GSM and Mobile money players have considerably performed well in the FY ended Dec 2021.
The good performance is not peculiar to Uganda, but the last two years have seen a jump in telecom and big tech fortunes resulting from sustained COVID-19-fueled demand all over the world. In Uganda, we have recorded more than 20% growth in data revenues, 10% growth in Fintech revenues to prop up the single-digit growth in voice services.
The above notwithstanding, we should take note of enduring macro challenges such as the continued local currency depreciation against major currencies. This is a big challenge in light of the value chain’s exposure to USD debt and capital expenditure.
We also remain challenged by comparatively low data uptake with the average user only consuming 1.1 Gb per month. This low uptake stifles consumer price drops.
On average, what has been the trend in the pricing of communication services, including Mobile Money? Would you say the market is enjoying economies of scale or the scales are tilting in favour of telcos?
The telecommunications sector is one of the few sectors with consistent price drops over the years despite the increases in cost of factor inputs such as fuel and forex depreciation. On average, Uganda has enjoyed consistent improvement in the affordability of communication services with average mobile voice and data prices dropping by more than 25% and 88% in the last 10 years.
We may choose not to comment on the prices of mobile money because of changes in regulatory framework of Mobile Financial Services in Uganda.- BOU. Nevertheless, the average price for sending money was UGX 660 in 2011 compared to UGX 533 to date. Sending UGX 5,000 cost a customer UGX 400 in 2011 compared to UGX 100 today. Customers are enjoying harmonized sending charges to other networks, countries, as well as banks.
Overall, the evolution of the communications sector has registered remarkable improvement.