
I’ve been a minority shareholder in Stanbic Bank Uganda for a while now. And like many retail investors, I occasionally take an interest in their performance, most times I just wait for the dividend and eat the money. When I take an interest in the performance, it is to occasionally answer the question:
Should I sell, hold, or accumulate?
The 2024 audited results offered a great opportunity to benchmark Stanbic’s performance against some of its top-tier peers: Absa Bank Uganda, Bank of Baroda Uganda (BOBU), and dfcu Limited. So I reviewed each bank’s 2024 numbers, compared performance themes, and took note of risks and opportunities. What follows is both an analysis of the sector—and a bit of insight into how I think as a long-term investor.
1. The 2024 Scorecard: How the Peer Banks Stack Up
2. My Stanbic Watchlist: Strengths & Risks
From the review, Stanbic remains the most dominant and resilient bank compared to peers.
Here’s how I see it:
Strengths
Strong Profitability: UGX 478 billion in profit and a 24.3% ROE—this is hard to beat
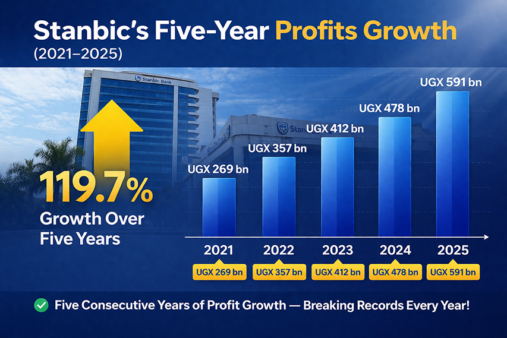
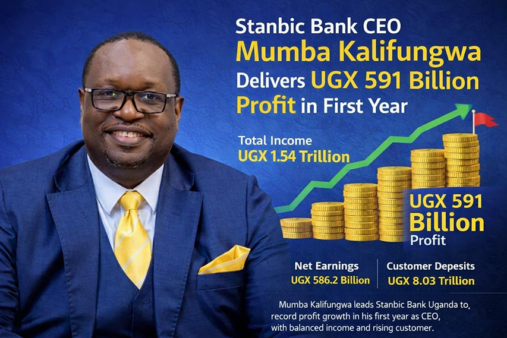
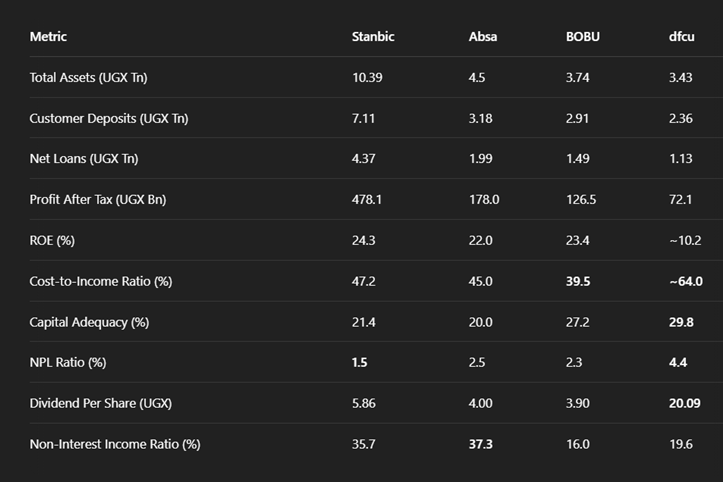
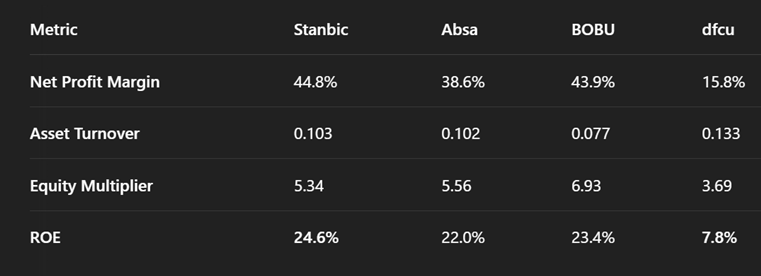
In 2024, Stanbic Bank Uganda reported a net profit of UGX 478.1 billion, comfortably leading the banking sector in absolute earnings. That’s more than double Absa’s UGX 178 billion and nearly four times dfcu’s UGX 72.1 billion. But Stanbic’s strength lies not just in scale—but in efficiency and capital productivity.
The bank delivered an impressive Return on Equity (ROE) of 24.3%, making it one of the most profitable banks on the Uganda Securities Exchange. Using the DuPont decomposition, we can see what’s driving this return:
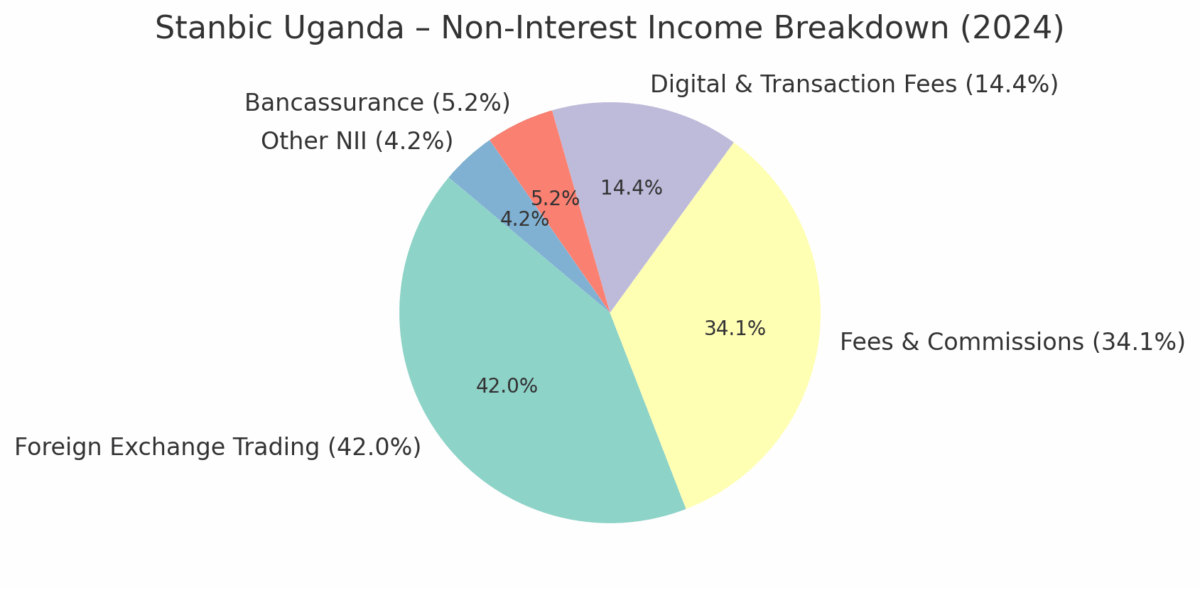
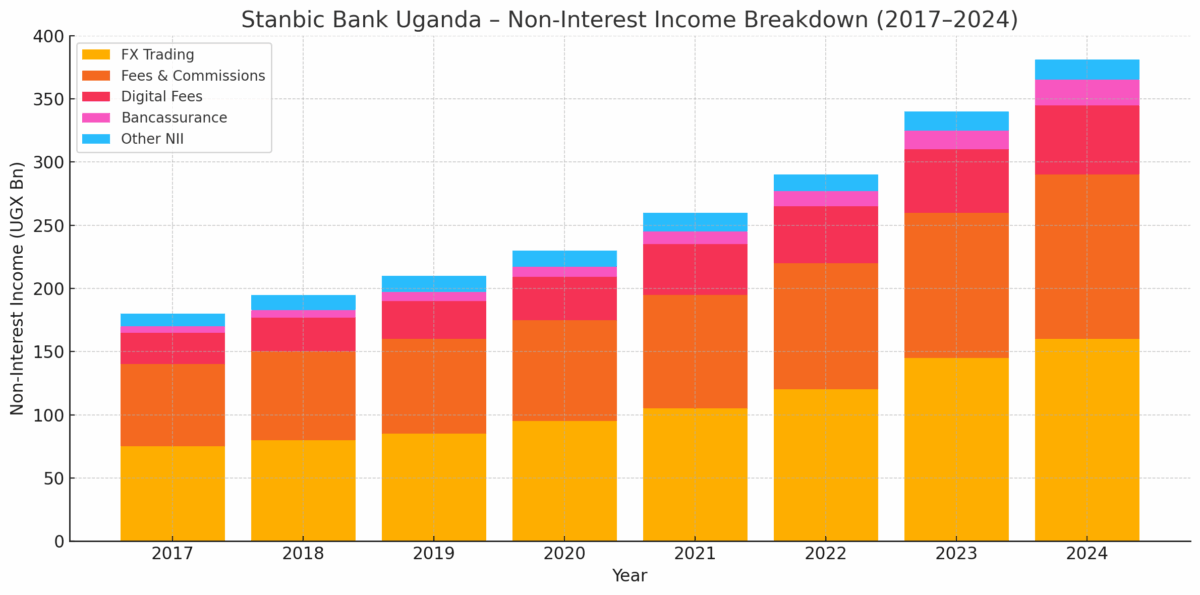
Diversified Income: 35.7% of revenue from non-interest sources (FX, digital services, insurance) – One of Stanbic Bank Uganda’s key strategic strengths is its revenue diversification—with 35.7% of total income in 2024 coming from non-interest sources. This is well above the market average and points to a mature, resilient business model that isn’t overly reliant on traditional lending.
Why This Matters (as a shareholder)
- Stability Across Cycles: When interest rates fall or lending slows, NII provides a buffer to sustain earnings.
- Margin Expansion: Non-interest income often has higher margins than lending and requires less capital to generate.
- Competitive Moat: Building strong NII streams requires tech infrastructure, client relationships, and regulatory trust—a high barrier to entry for smaller or newer banks.
- As a shareholder, I see Stanbic’s NII not just as a revenue line—but as a strategic shield against shocks, and a growth engine with upside in the digital economy.

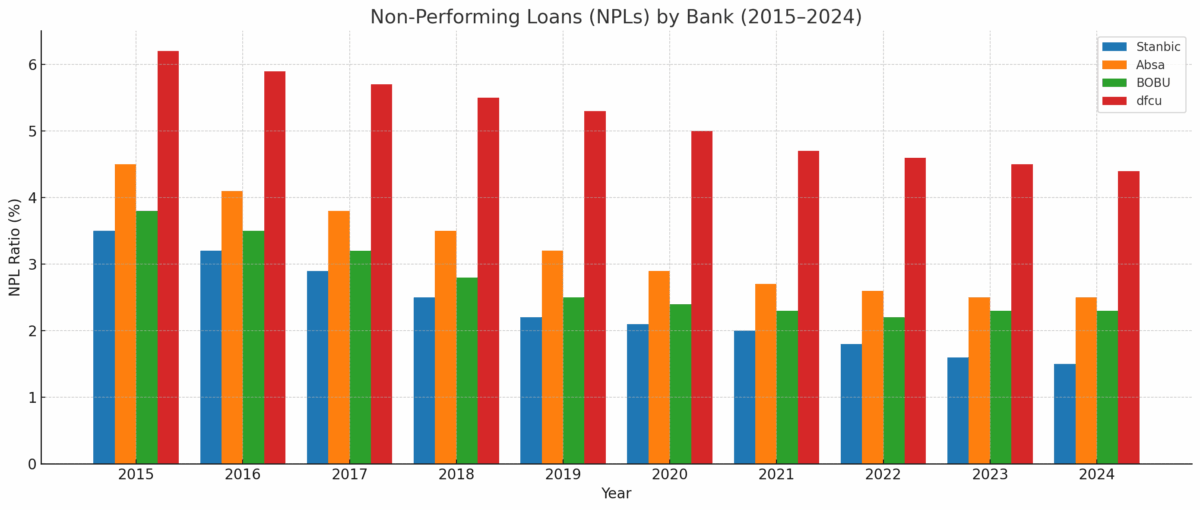
Clean Loan Book: NPLs at just 1.5% vs dfcu’s 4.4%.
Over the last decade, Stanbic Bank Uganda has consistently maintained one of the lowest non-performing loan (NPL) ratios in the market, improving from 3.5% in 2015 to just 1.5% in 2024. This long-term trend underscores Stanbic’s conservative credit culture, disciplined underwriting, and robust loan monitoring systems. In contrast, dfcu has struggled with elevated NPLs—averaging over 5% for much of the past decade, and only recently declining to 4.4%. Peers like Absa and BOBU have also carried higher NPL levels throughout the period, despite stable books. As shown in the chart below, Stanbic has become a benchmark for asset quality in Uganda’s banking sector. For shareholders, this matters: a clean book reduces provisioning costs, supports earnings stability, and frees up capital for dividend payouts and new lending—particularly in higher-risk but higher-growth segments like SMEs.
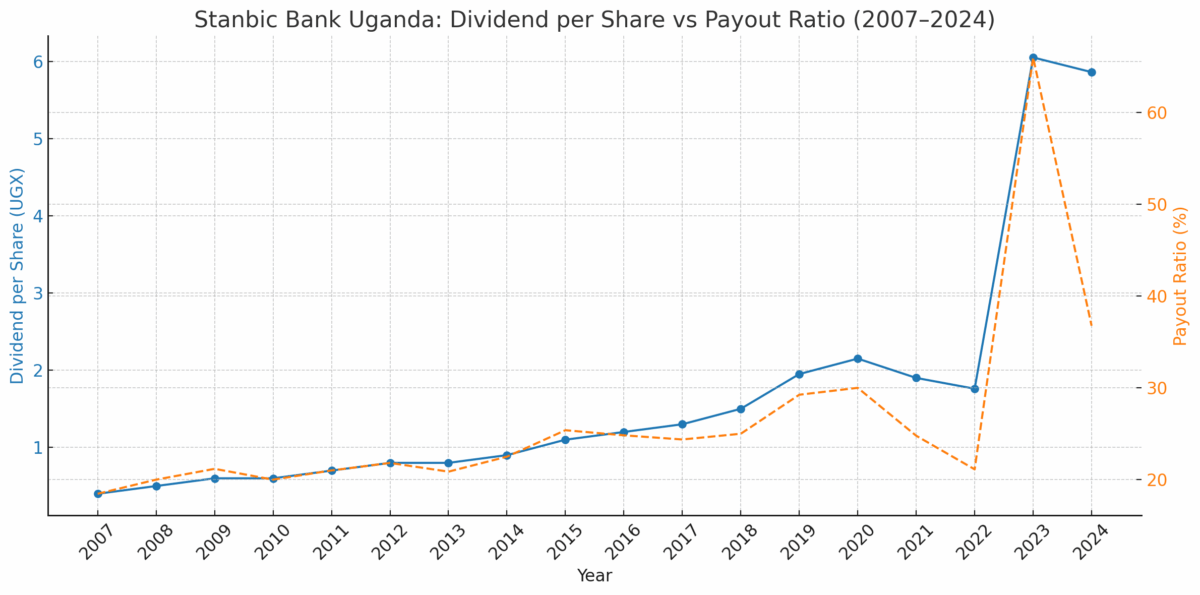
Dividend Consistency: UGX 5.86/share is reasonable and backed by earnings.
Stanbic Bank Uganda’s 2024 dividend of UGX 5.86 per share—split between an interim UGX 2.73 and a final UGX 3.13—continues a long-standing track record of consistent payouts. Since its IPO, Stanbic has paid dividends almost every year, even during downturns, setting it apart on the USE for reliability. The 2024 payout is backed by strong fundamentals, with a net profit of UGX 478.1 billion and a payout ratio of approximately 39%, reflecting disciplined capital management. For shareholders like me, this translates to a cash yield of ~12.5%, making it not only an attractive income play but also a sign of Stanbic’s commitment to delivering value from real, repeatable earnings. It’s the kind of dividend I can trust—earned, sustainable, and shareholder-focused.
Risks to Monitor
 OPINION: It’s Not Just More Work—Boardroom Leadership Has Become a Different Kind of Job
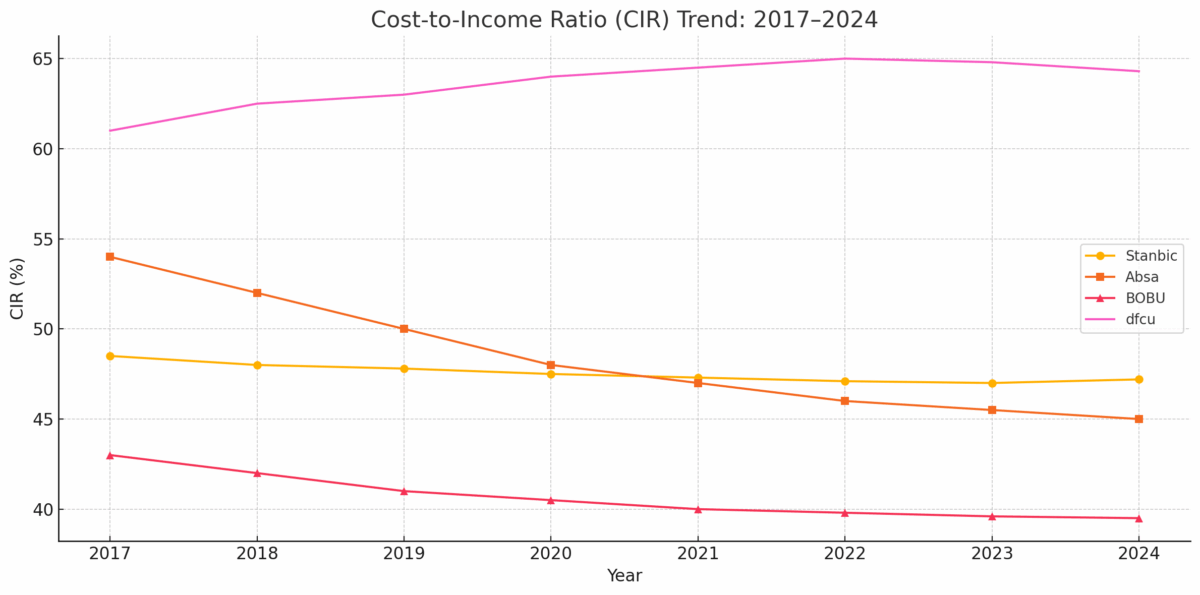
Cost Efficiency: Cost to Income Ratio (CIR) at 47.2% is decent, but Absa and BOBU are leaner. I’d like to see this trend lower over the next 2 years.
Stanbic’s cost-to-income ratio (CIR) of 47.2% in 2024 is respectable for a universal bank of its scale, especially given its wide physical and digital footprint. However, peer banks like Absa (45%) and BOBU (39.5%) are operating leaner—generating more income per shilling spent. While Stanbic’s CIR has remained stable over recent years, I’d like to see a downward trend toward 44–45% in the next 1–2 years. With continued investment in digital infrastructure and improved operational leverage, there’s real potential to unlock more margin without compromising service delivery. For a shareholder, cost discipline is just as important as topline growth—it directly impacts profitability and dividend capacity.
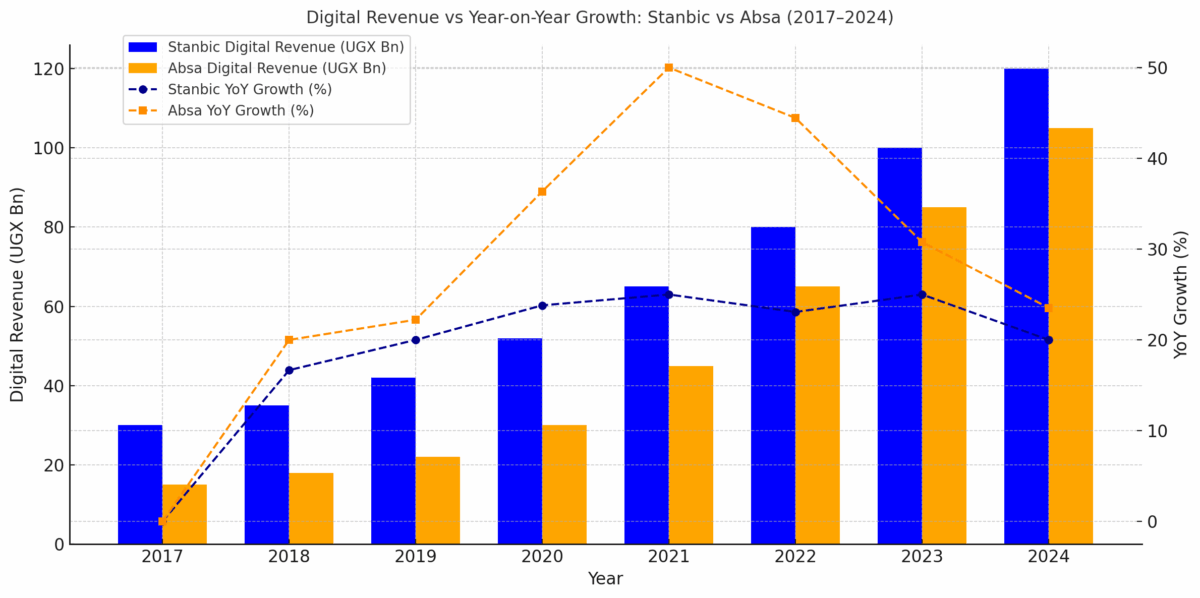
Market Share Pressure: Absa is gaining fast in digital and card business. Stanbic needs to defend its retail edge.
Stanbic remains the market leader in digital banking by volume and revenue—but Absa is gaining fast. As shown in the charts, Absa’s digital transactions and revenue have surged since 2020, growing faster than Stanbic year-on-year. While Stanbic’s scale gives it an edge, Absa’s growth reflects strong momentum in mobile, card, and fintech-driven retail channels.
To maintain its lead, Stanbic must move decisively—investing in digital experiences, SME solutions, and customer stickiness. In a market where convenience and speed drive loyalty, the biggest bank can’t afford to be the slowest mover.
FX Dependency: A lot of non-interest income comes from FX trading—vulnerable to regulation or external shocks.
As the charts below show, foreign exchange trading remains the largest and most consistent contributor to Stanbic’s non-interest income (NII), growing at an impressive 11.4% CAGR between 2017 and 2024. However, this strength also presents a concentration risk. FX income is highly sensitive to regulatory interventions—such as tighter spread limits or transaction disclosure rules—that could erode margins. It’s also exposed to external shocks like currency stability, declining trade flows, or geopolitical disruptions that may reduce volume. While FX has powered earnings in good times, it is less predictable in stressed environments. Encouragingly, faster-growing streams like bancassurance (22% CAGR) and digital fees (~12%) signal a shift toward a more balanced and resilient NII mix—critical for sustaining performance regardless of macro conditions.
3. How Other Banks Are Playing the Game
Absa is the fastest riser—innovative, efficient, and now generating over 37% of its income from non-interest sources. They’re gaining market share.
BOBU wins on discipline and efficiency. With a cost-to-income ratio of 39.5%, they convert more revenue into profit than anyone else. But they don’t take big swings—no real SME or digital push yet.
dfcu is still rebuilding. They posted a profit this year and paid the highest dividend per share—but it’s too early to call a turnaround. With NPLs at 4.4% and CIR at 64%, they’ll need to cut costs and grow smarter.
4. What I’m Watching for in 2025
As a shareholder, I won’t rush to exit—but I won’t blindly hold either. Based on the foregoing, here’s what I’ll be watching for before deciding whether or not to accumulate more:
- Can Stanbic get its CIR closer to 45% or below?
- Will digital services and SME lending keep growing market share?
- Does the dividend remain sustainable amid competition?
- Is NII stable, especially if FX markets tighten?
5. Final Thought: Why I’m Holding—for Now
This year’s numbers reaffirm my belief that Stanbic is still a quality asset in a growing market. Their fundamentals are strong, and they’re well-positioned across retail, SME, and corporate banking. But as a shareholder, I know performance is not guaranteed. I’ll keep tracking the trends—and if Stanbic keeps improving efficiency while holding market share, I’ll be happy to accumulate more.
Thanks for reading.
If you’re also a Stanbic shareholder—or follow the Ugandan banking sector—let me know what you’re seeing.