This article embarks on a journey that delves into the realm of financial statements, peeling back the layers to reveal the essential role played by Ugandan banks in the intricate credit creation process. Our exploration closely examines these financial reports, shedding light on how recent market dynamics and trends are reshaping the flow of funds, resulting in a discernible reduction in the amount of deposits being extended as loans to Ugandan customers.
Uganda’s financial landscape is evolving, and its banks are adapting to these changes. Join us on this enlightening expedition as we navigate the complex terrain of banking, dissect the implications of increasing risk aversion, and probe its far-reaching impact on credit creation. Whether you’re a local entrepreneur, an investor intrigued by Uganda’s economic landscape, or simply someone with a curiosity for the unfolding financial dynamics in this East African nation, the insights gleaned from these financial statements resonate with us all.
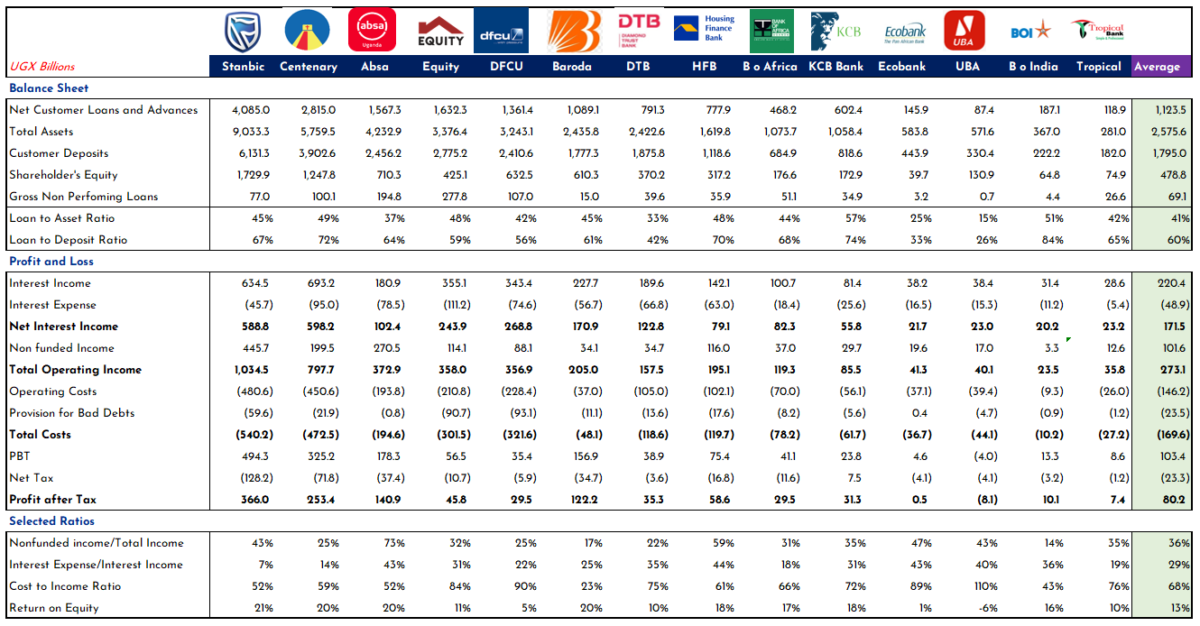
As we present this analysis, it’s pertinent to note that Uganda’s banking sector comprises 25 banks, of which we have accessed financial statements from 14 institutions, enabling us to conduct the insightful examination presented below.
Balance Sheet Analysis.
Net Loans and Advances: Among the 14 institutions under scrutiny, the average Loans and Advances stood at UGX 1,123 billion (USD300M). Stanbic led the pack with the highest year-end outstanding amount, a staggering UGX 4,085 billion (USD1,084M), while Tropical reported the lowest at UGX 87.4 billion (USD23M). Centenary and Equity followed closely in the 2nd and 3rd positions, with their net loans and advances totalling UGX 2,815 billion (USD 747 M) and UGX 1,623 billion (USD 430 M), respectively.
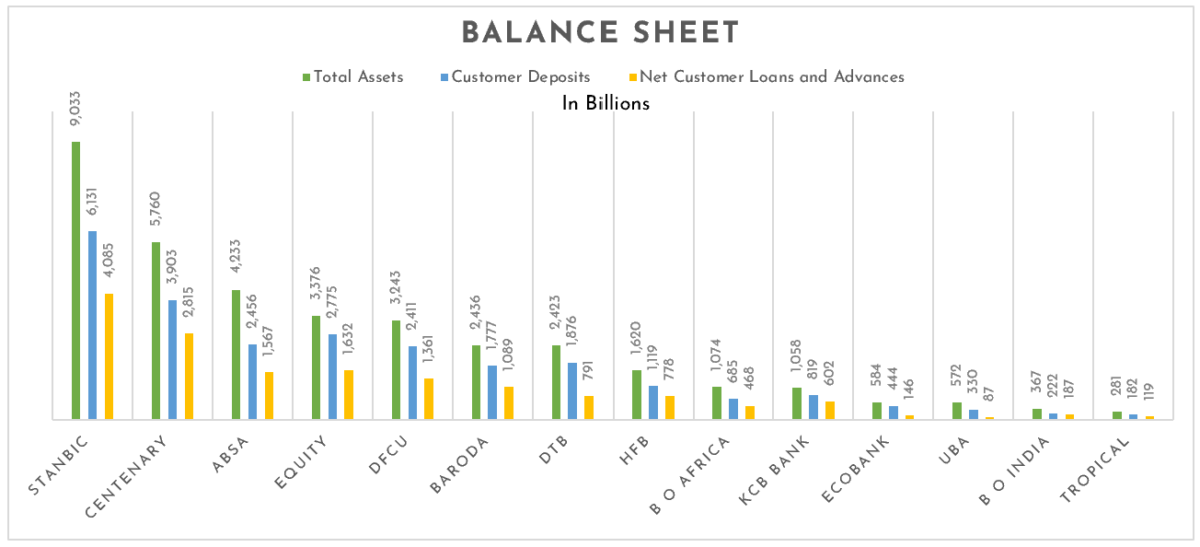
This trend was similarly reflected in the realm of Total Assets, with Stanbic maintaining the highest total assets at UGX 9,033 billion (USD2,397M).
However, a shift in perspective arises when we examine the portion of a bank’s assets allocated as loans to customers. Notably, the data reveals that, on average, only 41% of a bank’s assets have been extended as loans to customers. Remarkably, KCB Bank and Bank of India emerge as exceptions, with over 50% of their assets committed as loans to customers. This suggests that most Ugandan banks are holding a significant portion of their assets in alternative forms rather than channelling these resources into loans, potentially affecting the credit creation process.
Customer Deposits: Stanbic continued to lead in the realm of customer deposits, reporting a substantial figure of UGX 6,131 billion (USD1,627M). Centenary and Equity maintained their positions in 2nd and 3rd place, ending the year with customer deposits of UGX 3,902 billion (USD1,035M) and UGX 2,775 billion (USD737M) respectively. Meanwhile, Bank of India and Tropical Bank reported the lowest customer deposits, standing at UGX 222 billion (USD58M) and UGX 182 billion (USD48M) for the period under review.
Loan to Deposit Ratios: Commercial banks play a vital role in the credit creation process, as they receive customer deposits at lower interest rates and subsequently extend these funds as loans at higher interest rates. Our analysis of the loan-to-deposit ratios of these 14 institutions revealed an average loan-to-deposit ratio of 60%. Notably, Bank of India, KCB Bank, and Centenary Bank led the way with the highest loan-to-deposit ratios at 84%, 74%, and 72%, respectively.
These banks also demonstrated similar balance sheet distributions, with their loan-to-asset ratios at 51%, 57%, and 49%, respectively.
Conversely, UBA Bank reported the lowest loan-to-deposit ratio at 26%. This discrepancy can be largely attributed to a substantial portion of their balance sheet allocated to other financial instruments, amounting to UGX 459 billion (USD121M), which is approximately five times their net loans and advances. This strategic choice reflects their distinctive approach within the Ugandan banking landscape.
Income and Costs Analysis.
Banks derive a significant portion of their income from interest on advances, which is crucial to their operations. They also incur expenses related to interest payments to other financial institutions and depositors who provide them with the necessary funds for lending.
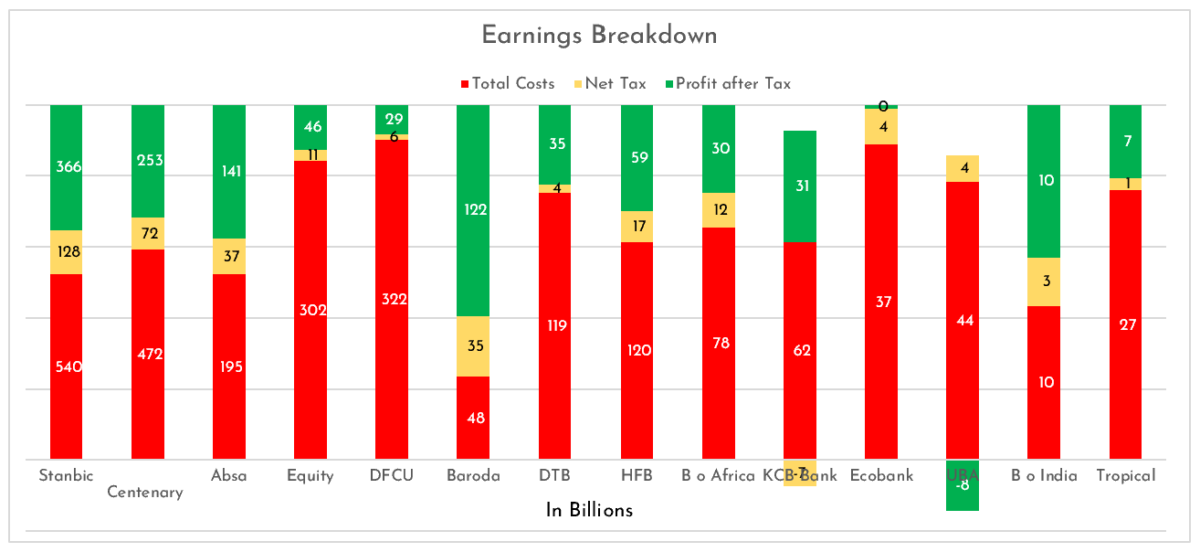
Net Interest Income: In the analysis of net interest income, Centenary Bank emerged at the forefront with the highest earnings of UGX 598 billion (USD159M) after adjusting for interest expenses. Stanbic Bank closely followed, reporting earnings of UGX 589 billion (USD156M) during the same period. Among the 14 institutions under review, the lowest net interest income was reported by Ecobank and Bank of India, with figures of UGX 21.7 billion (USD5.8M) and UGX 20.2 billion (USD5.4M), respectively.
Non-Funded Income (Income from Other Sources): Turning to income from non-funded sources, Stanbic Bank and Absa Bank stood out with the highest earnings at UGX 446 billion (USD118M) and UGX 271 billion (USD72M), respectively. Bank of India reported the lowest non-funded income, totaling UGX 3.3 billion (USD0.9M).
Total Costs: When we examine total costs, Stanbic Bank emerged as the leader, with expenses reaching UGX 540 billion (USD143M) for the period. Centenary, dfcu, and Equity Banks followed, each incurring costs of UGX 473 billion (USD126M), UGX 322 billion (USD85M), and UGX 302 billion (USD80M), respectively. Tropical Bank and Bank of India maintained the lowest costs at UGX 27 billion (USD7.2M) and UGX 10 billion (USD2.7M), respectively. These cost variations underscore the diverse strategies and operating environments within the Ugandan banking sector.
Profit After Tax: The performance bottom line continued to be dominated by Stanbic and Centenary Banks, both reporting substantial profits for the period. Stanbic Bank posted a profit of UGX 366 billion (USD97M), closely followed by Centenary Bank, with UGX 253 billion (USD67M) in earnings.
Among the other 12 institutions in the review, Bank of Baroda stood out, reporting a profit of UGX 122 billion (USD32M). It placed just below Absa Bank (UGX 141 billion) but surpassed Equity Bank (UGX 46 billion) and dfcu Bank (UGX 30 billion), despite the latter two banks having higher income figures than Baroda.
On the lower end of the spectrum, Tropical Bank and Ecobank reported the lowest Profit After Tax, with earnings of UGX 7.4 billion (USD2M) and UGX 0.5 billion (USD0.1M), respectively. In contrast, UBA reported a loss of UGX 8.1 billion (USD2.2M), highlighting the diverse financial outcomes within the Ugandan banking sector.

Performance Ratios.
Non-Funded Income to Total Income: Typically, a substantial portion of a bank’s income is derived from their funded sources, primarily related to earnings from their core activities, such as lending to customers. Banks tend to aim for lower non-funded income since it generally yields a lower return compared to income generated from loans and advances.
In our analysis of the 14 institutions, the average ratio of non-funded income to total income stood at 36%. Notably, Absa reported the highest ratio of non-funded income, accounting for 73% of its total income. Following closely were Housing Finance and Ecobank, with ratios of 59% and 47%, respectively, indicating a significant share of non-funded income in their overall income mix.
Interest Expense to Interest Income Ratio: As mentioned earlier, banks incur interest expenses on customer deposits and loans and advances received from other financial institutions. This ratio reflects which banks are efficiently managing the costs associated with customer deposits in comparison to the income generated from lending activities. From our analysis, we found that Stanbic reported the lowest Interest Expense to Interest Income ratio at 7%, signifying efficient management of costs. Centenary and Bank of Africa followed with ratios of 14% and 18%, respectively.
Housing Finance recorded the highest ratio at 44%, followed closely by Absa and Ecobank, both at 43%. This trend aligns with our earlier findings on non-funded income, where these banks exhibited relatively high non-funded income compared to other entities. The average interest expense to interest income ratio for the period was 29%.
Cost to Income Ratio: We also assessed the efficiency of the banks, specifically by analyzing the ratio of their operating costs to income generated. The average cost-to-income ratio for the 14 financial institutions was 68%. However, our analysis highlighted that the most efficient financial institution for the period was Bank of Baroda, with a cost-to-income ratio of 23%. This suggests that for every UGX 1,000 generated, the bank only incurred UGX 230 in operating costs, indicating a high level of operational efficiency.
Bank of India reported a cost-to-income ratio of 43%, indicating efficient cost management. Stanbic and Absa followed closely, each with a ratio of 52%. Of the 14 institutions analyzed, UBA stood out as the most inefficient, with a cost-to-income ratio of 110%. This signifies that UBA incurred UGX 1,100 in operating costs for every UGX 1,000 earned as income during the period, which is further underscored by the loss reported for the same period, highlighting the need for improved operational efficiency.
Conclusion.
As we conclude our exploration of Uganda’s banking sector, it’s evident that the financial landscape is undergoing transformative shifts. The crucial role played by banks in fostering economic growth, facilitating homeownership, and empowering businesses remains unwavering. However, the evolving dynamics within the industry warrant a deeper understanding.
The analysis of financial statements from 14 Ugandan banks has shed light on a vital trend – the allocation of deposits as loans. With a noticeable decrease in this allocation, questions arise about the reasons behind the apparent shift in risk aversion. Are banks becoming more cautious in their lending practices due to changing market conditions and regulatory pressures? Are the benefits/lower returns from the hassle-free government paper outweighing the higher returns from hassle-full loans and advances? The numbers certainly suggest so.
In this intricate terrain of banking, we’ve uncovered varying levels of efficiency, non-funded income, and interest expenses among the banks, emphasizing the diverse strategies employed within the sector. As we’ve seen, financial institutions like Stanbic, Centenary, and Bank of Baroda lead in various financial metrics, while others chart their unique paths.
While some banks are directing a significant share of their assets toward non-funded income, potentially diversifying their revenue streams, others are more inclined to focus on their core lending activities. This divergence in strategies highlights the adaptability of Ugandan banks in a rapidly evolving environment.
Uganda’s financial landscape is a dynamic stage where banks are responding to market challenges and seizing opportunities. Whether you’re an entrepreneur seeking loans, an investor eyeing the banking sector, or merely curious about Uganda’s economic growth, the insights within these financial statements touch us all.
In the pursuit of a more resilient and prosperous banking ecosystem, it’s essential for all stakeholders to recognize and navigate these shifts effectively. By doing so, we can collectively contribute to a more robust and stable financial sector, enhancing the avenues for credit creation and economic growth in Uganda.
As Uganda’s banking sector continues to evolve, staying informed and adaptability will be key, and this journey of exploration into the banking landscape is far from over. The next chapter in this story will depend on how banks respond to the evolving terrain, how regulators shape the industry, and how entrepreneurs and investors navigate these waters.
We hope that this analysis has provided valuable insights into the inner workings of Uganda’s banking sector, and we look forward to the unfolding chapters that will define the future of banking in this East African nation. Thank you for joining us on this journey.
Disclaimer: The analyst makes no representation or warranty in relation to the accuracy, completeness or reliability of the information contained in this analysis. The analysis is not intended to be an exhaustive statement on the issue, markets or developments arrived to in the research. Any opinions expressed are subject to change without notice.