

The Deputy Governor, Bank of Uganda, Prof. Augustus Nuwagaba, has drawn attention to a key structural feature of Uganda’s recent gold export performance: while gold has become the country’s largest source of export receipts, it also appears to be associated with a large import invoice, resulting in a relatively modest net trade balance.
Speaking at the Stanbic Bank Uganda Economic Forum at the Sheraton Kampala Hotel on Thursday, February 11th, 2026, Prof. Nuwagaba said Uganda earned approximately USD6.4 billion from gold exports, compared to approximately USD2.4 billion from coffee exports and about USD700 million from cocoa. He then noted that gold is also the highest import invoice, creating what he described as a “paradox” in the trade balance.
“Gold is commodity number one,” he said. “We earned approximately $6.4 billion. Then the next one is coffee, $2.4 billion, then you have cocoa of about $700 million, then you have others… Unfortunately, gold is the highest export receipt we get, but also it’s the highest import invoice that also we get. That’s the paradox.”
He added that, when considering the trade balance for gold alone, the net difference is approximately USD 200 million.
“When you look into the trade balance for gold only, it is about $200 million only,” he said. “What does that imply?… It means, actually, that gold most possibly is not ours.”
Growth and volatility in gold export earnings
Bank of Uganda export data indicates that Uganda’s gold exports reached USD6.40 billion in 2025, accounting for 47.7% of total merchandise exports valued at USD13.43 billion. In the same year, coffee export earnings stood at USD2.46 billion (18.3% of total exports), cocoa beans earned USD632 million (4.7%), tea generated USD54 million(0.4%), and cotton brought in USD11.8 million (0.1%). These figures confirm that gold has become Uganda’s single largest contributor to export receipts, with earnings more than double those of coffee and larger than most other exports combined.
| Year | Total Exports | Gold Exports | Gold % of Total | Coffee Exports | Coffee % of Total |
| 2019 | 4,095.65 | 1,257.82 | 30.7% | 438.54 | 10.7% |
| 2020 | 4,461.30 | 1,819.27 | 40.8% | 515.53 | 11.6% |
| 2021 | 4,493.85 | 1,033.36 | 23.0% | 718.96 | 16.0% |
| 2022 | 4,275.49 | 200.64 | 4.7% | 859.47 | 20.1% |
| 2023 | 6,879.46 | 2,229.15 | 32.4% | 965.33 | 14.0% |
| 2024 | 8,668.44 | 3,378.92 | 39.0% | 1,547.14 | 17.8% |
| 2025 | 13,433.64 | 6,402.74 | 47.7% | 2,462.87 | 18.3% |
The Bank of Uganda export table further shows that gold export earnings increased from USD1.26 billion in 2019 to USD6.40 billion in 2025, representing an overall increase of USD5.14 billion and a cumulative growth of approximately 409% over the period. This translates into a growth multiple of about 5.1 times and an estimated compound annual growth rate (CAGR) of approximately 31% per year between 2019 and 2025. However, the trajectory has been highly volatile rather than linear. Gold export earnings rose from USD1.26 billion (2019) to USD1.82 billion (2020) — a year-on-year increase of 44.6% — before declining to USD1.03 billion (2021), a fall of 43.2%, and then collapsing to USD200.6 million (2022), representing a further decline of about 80.6%. From that low base, earnings rebounded sharply to USD2.23 billion (2023), an increase of over 1,000%, then rose to USD3.38 billion (2024) (+51.6%), before surging again to USD6.40 billion (2025) (+89.5%).
Export volumes reflect a similar pattern. The table shows that gold export volumes fell from 18,990 kilograms in 2021 to 3,897 kilograms in 2022, a decline of about 79.5%, before recovering to 62,018 kilograms in 2025. This volume rebound indicates that the post-2022 surge was driven not only by price movements but also by a substantial increase in the physical quantities of gold being exported.
Coffee export performance in the same period
Coffee export earnings increased from USD438.5 million in 2019 to USD2.46 billion in 2025, reflecting a substantial rise over the period. This growth was accompanied by higher export volumes, which increased from 4.53 million 60-kilogram bags in 2019 to 8.78 million bags in 2025. The combination of rising earnings and expanding volumes suggests that coffee’s improved performance has been supported by both stronger production and favourable pricing dynamics, consistent with broader sector expansion rather than purely price-driven gains.
Whose gold?
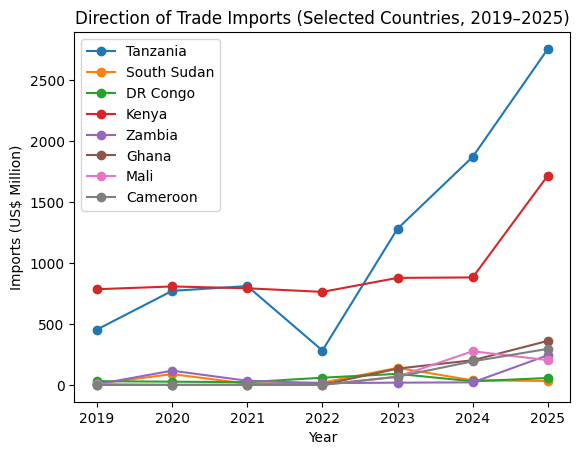
Bank of Uganda direction-of-trade data indicates that Uganda’s import profile has shifted significantly between 2019 and 2025, with substantial increases in import values from several African trading partners — including regional neighbours and a number of West African countries.
Imports from Tanzania rose from USD454 million in 2019 to USD2.76 billion in 2025, an increase of approximately USD2.30 billion, or about 507% over six years. This represents a more than six-fold expansion and implies an estimated compound annual growth rate (CAGR) of roughly 35% per year. Notably, the sharpest acceleration occurred after 2022, with imports rising from USD282 million in 2022 to USD1.28 billion in 2023, then to USD1.87 billion in 2024, and finally to USD2.76 billion in 2025.
Imports from Kenya increased from USD785 million in 2019 to USD1.72 billion in 2025, representing a cumulative rise of about 119% and an estimated CAGR of approximately 14% per year. While imports from Kenya remained relatively stable between 2019 and 2024 — fluctuating between USD760 million and USD880 million — the data shows a pronounced jump in 2025, when import values nearly doubled compared to 2024.
| Country | 2019 | 2020 | 2021 | 2022 | 2023 | 2024 | 2025 |
| Tanzania | 454.45 | 771.86 | 811.08 | 282.30 | 1,282.10 | 1,871.67 | 2,757.44 |
| South Sudan | 9.14 | 88.84 | 10.27 | 18.76 | 139.93 | 37.57 | 32.44 |
| DR Congo | 30.92 | 26.57 | 22.33 | 59.16 | 90.85 | 29.67 | 56.84 |
| Kenya | 785.26 | 808.16 | 793.06 | 763.58 | 878.44 | 882.11 | 1,718.51 |
| Zambia | 5.10 | 117.05 | 34.12 | 14.59 | 18.61 | 20.89 | 243.63 |
| Ghana | 0.06 | 0.14 | 1.12 | 1.35 | 134.00 | 202.48 | 361.50 |
| Mali | 6.46 | 0.00 | 0.00 | 0.01 | 67.09 | 276.21 | 203.08 |
| Cameroon | 0.01 | 0.06 | 0.04 | 0.47 | 67.39 | 193.73 | 295.93 |
Imports from Zambia expanded from USD5.1 million in 2019 to USD243.6 million in 2025, a more than 4,600% increase, equivalent to nearly 48 times the 2019 level. Although starting from a low base, this implies an exceptionally high estimated CAGR of roughly 90% per year over the six-year period. The largest absolute increase occurred in 2025, when imports surged from USD20.9 million in 2024 to USD243.6 million.
 Allan Chekwech Steps into Daniel Kalinaki's Big Shoes at NMG Uganda
A similar structural shift is visible in imports from several West African countries. Imports from Ghana rose from less than USD2 million annually between 2019 and 2022 to USD134 million in 2023, USD202 million in 2024, and USD361.5 million in 2025.
Imports from Mali increased from near-zero levels in 2020–2022 to USD67.1 million in 2023, peaked at USD276.2 million in 2024, and stood at USD203.1 million in 2025.
Imports from Cameroon moved from negligible levels prior to 2023 to USD67.4 million in 2023, USD193.7 million in 2024, and USD295.9 million in 2025.
The same table shows that imports from South Sudan increased from USD9.1 million in 2019 to USD139.9 million in 2023, before moderating to USD32.4 million in 2025, reflecting considerable year-to-year volatility.
Imports from the Democratic Republic of Congo also fluctuated, rising from USD30.9 million in 2019 to USD90.9 million in 2023, before easing and then recovering to USD56.8 million in 2025.
Importantly, the most rapid expansions in imports from several of these countries occurred between 2023 and 2025 — the same period during which Uganda’s gold export earnings rose from USD2.23 billion in 2023 to USD6.40 billion in 2025, an increase of nearly 187% in two years.
While the direction-of-trade data does not disaggregate imports by commodity at the bilateral level, the timing and scale of these shifts coincide with the acceleration of Uganda’s gold export boom.
Several of the countries experiencing sharp import growth — including Ghana, Mali, Tanzania and the Democratic Republic of Congo — are established gold-producing economies within Africa. The data therefore suggests a structural reconfiguration of trade flows during the same period in which gold became Uganda’s dominant export commodity by value. However, the tables themselves do not specify the commodity composition of these imports, and any direct linkage would require further disaggregated trade data.
Interpreting the “paradox” highlighted by the Deputy Governor
Prof. Nuwagaba’s remarks draw attention to an important distinction between gross export receipts and the net contribution of a commodity to the trade balance. In simple terms, a country can record very high export earnings from a commodity, yet retain a much smaller net benefit if the export activity is associated with a similarly large import bill. In the case of gold, his estimate of a net trade balance of approximately USD200 million, compared to gross export receipts of around USD6.4 billion, implies a relatively narrow margin in the overall gold trade chain.
This type of outcome may be consistent with a trade structure in which gold exports reflect a combination of domestically produced gold, imported gold or mineral inputs, refining and aggregation activity, and subsequent re-export or onward trade. While the Bank of Uganda tables do not directly disaggregate imports by commodity at the bilateral country level, the observed direction-of-trade shifts and the scale of gold export receipts provide a basis for further analytical inquiry into how the gold export value is structured and how much of it translates into net foreign exchange gains for the economy.
A question of structure, not only of value
The Bank of Uganda export table confirms that gold has become Uganda’s largest export commodity by value.
The Deputy Governor’s remarks introduce a further analytical question: how much of this export value represents net foreign exchange earnings from domestic production, versus value associated with imported inputs or externally sourced supply chains.
This distinction matters because export performance is often interpreted as a measure of domestic production strength, whereas trade hub activity can generate large export receipts with a smaller net contribution.